阅读下面短文,从每题所给的四个选项(A、B、C和D)中,选出最佳选项。
A
Last year some groups of students in their community(社区) make a survey about "How do people spend their free time?' The following diagrams (图表) show some results of it.
Diagram (1): Hours for people of different ages who surf the Internet in a week.
Diagram (2): Different days people go to the library.(library attendance)
Diagram (3): Different programs people like.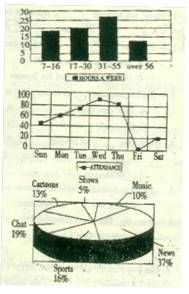
根据上面三个图表内容,选择正确答案People aged__________spend the most time surfing the Internet every week.
| A.7 ----16 |
| B.17 ------ 30 |
| C.31 ----- 55 |
| D.over 56 |
On Wednesday, __________people go to the library every week.
| A.over sixty |
| B.less than sixty |
| C.about twenty |
| D.more than one hundred |
According to the third diagram about ______of people like watching Cartoons?
| A.16%. |
| B.19% |
| C.13% |
| D.37%. |
Which statement is right according to the survey?
| A.Some students made the survey in their school last year. |
| B.More people like sports than chat in the survey. |
| C.Less than 80 people join in the survey about library attendance. |
| D.People of different ages spend different time surfing the Int ernet. |
The three diagrams show us the results of the survey about__________.
| A.what people do every day |
| B.how people spend their free time |
| C.people's different lifestyles |
| D.people's different habits |
Welcome Aboard (乘坐) your Piccadilly Flight to Heathrow
The Piccadilly line to Heathrow (伦敦西斯罗机场) is not only the fast way to travel but also the cheapest. So the next time you’re flying to Heathrow, make sure you fly Piccadilly line.
Your Piccadilly flight features (特点):
Departures (发车) from 36 stops on the Piccadilly line, or from over 200 stations only one change way
Service every 5 minutes to and from Heathrow throughout the day
Journeys from central London taking less than 50 minutes
Only £3.70 for a single adult fare(票价)
See tables below for journey times
Fares to and from London
Adult single £3.70
Child single £1.50
If you are traveling as a group, then you are allowed to use the family travel card, which means each adult can travel for £3.40, and each child for £0.80.
Traveling to Heathrow
| Monday - Saturday |
Sunday |
|||||
| From |
Journey time |
Frequency (频率) |
First train |
Last train |
First train |
Last train |
| Earls Court |
39mins |
5mins |
05:55 |
00:43 |
07:15 |
23:49 |
| Piccadilly Circus |
49mins |
5mins |
05:45 |
00:32 |
07:05 |
23:38 |
Traveling from Heathrow
| Monday - Saturday |
Sunday |
|||||
| To |
Journey time |
Frequency |
First train |
Last train |
First train |
Last train |
| Earls Court |
34mins |
5mins |
05:13 |
23:49 |
05:57 |
23:30 |
| Piccadilly Circus |
45mins |
5mins |
05:13 |
23:49 |
05:57 |
23:30 |
At what time does the first train leave Earls Court on Sunday?
| A.07:15 | B.05:55 | C.05:13 | D.05:57 |
If your father wants to take the train, how much should he pay?
| A.£1.50 | B.£3.40 | C.£3.70 | D.£5.20 |
If you miss a train, how long will it take to wait for another?
| A.39 minutes | B.49 minutes | C.50 minutes | D.only 5 minutes |
The last train to Piccadilly Circus on Wednesday leaves at ______.
| A.00:32 | B.00:43 | C.23:49 | D.23:30 |
If you travel with your mum and dad as a child, what is your best choice?
| A.All pay full fare. | B.Use the family travel card. |
| C.Each pay for his or her own. | D.Look for free tickets. |
A primary school teacher asked her students to write a composition about what they would like God to do for them. At the end of the day, while marking the compositions, she read one that impressed her deeply. Her husband, who had just walked in, saw her crying and asked her, “What happened?”
She answered, “Read this. It is one of my students’ compositions.”
“Dear God, tonight I ask you for something very special: Make me into a television. I want to take its place and live like the TV in my house. Have my own special place, and have my family around me. To be taken seriously when I talk, I want to be the centre of attention and be heard without interruption(打断) or questions. I want to receive the same special care that the TV receives even when it is not working. Have the company of my dad when he arrives home from work, even when he is tired. And I want my mom to want me close when she is sad and upset, instead of ignoring(不理) me. And ...I want my brothers to fight to be with me...I want to feel that my family just put everything aside, every now and then, just to spend some time with me. And last but not least, make sure that I can make them all happy and entertain(vt.娱乐) them. God, I don’t ask you for much. I just want to live like our TV. ”
At that moment the husband said, “My God, poor kid, what horrible parents!” .The teacher looked up at him and said, “That composition is our son’s!”Why did the teacher cry?
| A.Because a composition moved her deeply. |
| B.Because the composition was very bad. |
| C.Because the students were lazy. |
| D.Because she had a fight with her husband. |
Who was the boy that wrote the composition?
| A.student who was with God. |
| B.A student who was like a television |
| C.A student in her class, but not her son. |
| D.A student in her class, in fact, her son. |
According to the article, what will happen when the boy talks?
| A.Everyone will pay attention to him. |
| B.He will be interrupted. |
| C.No one will pay attention. |
| D.His mother will talk to him. |
Which is not right according to the passages?
| A.TV can entertain them |
| B.TV can catch the attention of his family. |
| C.TV can give you answers when you ask question. |
| D.TV can receive special care from his family. |
According to the article, we can know the boy is_________.
| A.naughty | B.lonely | C.happy | D.Wrong |


What do people want to do at Nancy’s Gym?
| A.To enjoy swimming | B.To learn skating |
| C.To become thinner | D.To become taller |
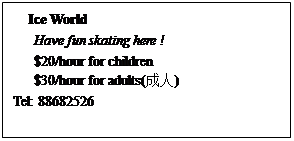
Lucy likes skating. Which advertisement is she interested in?
| A.Ice World | B.Water World | C.Nancy’s Gym | D.Keep fit |
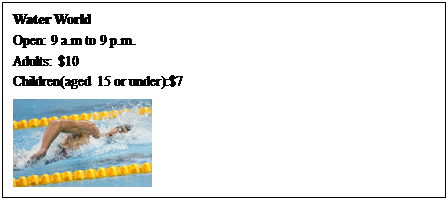
You can call at _________ when you want to swim.
| A.45562233 | B.88682526 | C.21518296 | D.85882526 |
You can go to swim in Water World at___________.
| A.8:00 a.m. | B.9:30 a.m. | C.10:00 p.m. | D.11:00 p.m. |
30. Which activity costs the most for an adult?
| A.Keeping fit at Nancy’s Gym. |
| B.Skating in Ice World. |
| C.Swimming in Water World. |
| D.Making the Telephone. |
A school for stars
In this school, most students come from rich families and some of them have famous parents. People from Hollywood sometimes go to Beverly Hills High School to look for future actors.
School life
There are lots of good things about going to this school: There are two theatres, a television studio(演播室) and a radio station. The students make TV programmes and films in their drama(戏剧) classes. The biggest activity of the school year is the school dance.
Travelling to school
In California, children can learn to drive three months before their sixteenth birthday. Lots of students in Beverly Hills High School have their own cars, but they have to pay a lot of money to park(停) their cars in the school parking area.
What the children think
Most children enjoy going to Beverly Hills High School because it is fun and there is much to do. But some children do not like the school if their parents don’t have enough money to buy them a fast car or expensive clothes. From the first paragraph, we can know that_________.
| A.some students in Beverly Hills High School may become actors in the future |
| B.all the students in Beverly Hills High School come from the USA |
| C.the parents of the students in Beverly Hills High School are usually very common |
| D.the students in Beverly Hills High School are poor |
The students make TV programmes and films ___________.
| A.in a theatre | B.in a television studio |
| C.in a radio station | D.in their drama classes |
Lots of students in this school come to school ___________.
| A.by bike | B.by car | C.by plane | D.on foot |
Why do most children enjoy going to Beverly Hills High School?
| A.Because they will be actors in the school. |
| B.Because they will have a fast car and expensive clothes |
| C.Because they can make TV programmes and films in their drama classes. |
| D.Because it is fun and there is much to do in the school. |
Which of the following is NOT true according to the passage?
| A.Not all the students like the school. |
| B.The biggest activity of the school year is the school dance. |
| C.In California, children can learn to drive three months before their fifteenth birthday |
| D.Lots of students have to spend much money parking their cars in the school parking area. |
Michael Jordan was one of the most important basketball players in the world during the 1990s.He won the NBA’s Most Valuable Player Award five times.Jordan led(带领)the Chicago Bulls to his first there championships in 1991 ,1992and 1993.In October of 1993 he surprised his fans by retiring form basktball and became a professional baseball player.He said that playing baseball was an early dream of his .He played during the 1994 baseball season(赛季)for the Birmingham Barons.In March of 1995 he ended his baseball career and went back to the Bulls.With Jordan,the Bulls won there more championships in 1996,1997and1998.He retired form basketball in 1999.In the year 2000 he became one of the owners of the NBA’s Washington Wizards.In 2001 Jordan began thinking of another comeback as an NBA player .That fall ,at the age of 38,he returned once again to play for the Wizards.He played for two more full seasons and retired again in April of 2003.
根据短文内容,回答问题How many championships did Jordan lead the Chicago Bulls to win?
Why did Jordan want to be a baseball player?
In which year did Jordan retire from basketball for the second time?
How many famous basketball teams are mentione(提到的)in the passage?Give the names.
What are you going to be when you grow up?
 粤公网安备 44130202000953号