Last year, some groups of students in their community (社区) made a survey about “How do people spend their free time? ” The following diagrams(图表) show some results of it:
Diagram (1): Hours for people of different ages who surf the Internet in a week.
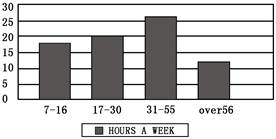
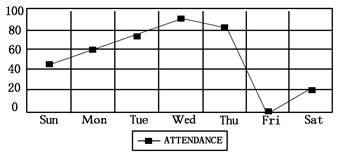
Diagram (2): Different days people go to the library. (library attendance)
|
| A.7—16 | B.17—30 | C.31—55 | D.over 56 |
The word “attendance” in Diagram (2) means “ in the library”.
| A.the hours people spend | B.the number of people |
| C.the number of books | D.the days people spend |
How many people go to the library on Saturdays?
| A.About 20%. | B.About 40%. |
| C.Over 60%. | D.More than 80%. |
Which of the following is TRUE according to the diagrams?
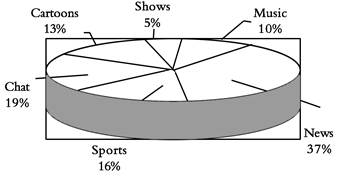
| A.The fewest people like watching music programs. |
| B.Sports are the most people’s favorite programs. |
| C.People seldom go to the library on weekdays. |
| D.Half of the people like watching news and cartoons. |
The three diagrams show us the results of a survey about .
| A.what people do every day | B.people’s different habits |
| C.people’s different lifestyles | D.how people spend their free time |
Everyone dreams of changing the world. But can teenagers really make a difference? And how can they go about it?
Michael Norton's book 365 Ways to Change the World is a good starting point. The book gives an idea or task for every single day of the year. The tasks include offering to work at a local homeless shelter (庇护所) and planting a tree.
The book says that one simple act, no matter how small, can help someone in need. It may even influence (影响) other teens to do something.
Nathan Anthony, a student at Maple High School in Modesto, California, US, agrees. “It is impossible to get anything in life without giving something to someone or working hard at school or workplace," Anthony said.
Another Maple student, Ariane Mota, has the same idea." Giving is our way of repaying those who help us," she said." Whether it is a helping hand or a donation, we should help others to make their day or life better."
But how often do teens see peers (同龄人) helping a stranger or doing something nice for someone?
According to Anthony, not a lot. He and Mota both believe this needs to be changed.
"I help my friends by telling them that their lives are better than those poorer people," Anthony said." Humor is also a great tool."
So whether you're helping to find a cure (疗法) for bad illness or simply smiling at a stranger, do something every day to help change the world for the better.365 Ways of Changing the World is a book __________.
| A.written about Michael Norton. |
| B.about what teenagers learn at school |
| C.that gives teenagers an idea or task for every single day of the year |
| D.about how to work in a shelter. |
Which of the following does not change the world for the better?
| A.Eating a delicious meal |
| B.Telling friends that their lives are better |
| C.Helping find a cure for cancer (癌症) |
| D.Smiling at a stranger |
According to Nathan Anthony, how many teens can be seen helping a stranger or do something nice for someone?
| A.a lot of teens | B.Hundreds of teens |
| C.Some teens | D.Millions of teens |
How often does the passage tell us to do something to change the world better?
| A.Once a year | B.Every day |
| C.Once a week | D.Twice a day |
From the article, we know _____________.
| A.Michael Norton dreams of changing the world most |
| B.only great acts can influence other teens to do something |
| C.Nathan Anthony and Ariane Mota are both teenagers at Maple High School |
| D.humor does not belong to what teenagers should do to change the world |
In the sea there are many islands. In its warm waters there are some little ones. We call them “coral Islands” (珊瑚岛).
A coral island is very nice to look at. It looks like a ring of land(一圈陆地) with trees, grass, and flowers on it. One part of the ring is open to the water. There is a little round lake inside the island.
If you look into this lake, you will see beautiful coral. You may think they are flowers. If you look at a piece of coral, you will see many little holes in it. In each of these holes a very small sea animal lives. These sea animals make the coral.
They began to build under the water. Year after year, the coral grew higher and higher. At last it grew out of the water.
Then the sea brought it small trees and something else. After some years, these things changed into earth. Sometimes the wind brought seeds(种子) to this earth. Sometimes birds flew over it and brought seeds to the island.
The little seeds grew. In a few years there were plants all over the island. In a few more years there were trees growing there.
So you see, these islands were built little by little. The workers were very small. Do they not teach us a lesson? Can you think what the lesson is?In the sea _____.
| A.there are coral islands in all places |
| B.there are some coral islands |
| C.the water is always warm |
| D.we can see many flowers |
A coral island looks like _____.
| A.a round cake | B.trees, grass and flowers |
| C.a ring of land | D.a round lake |
There are _____ in the holes in corals.
| A.flowers | B.little corals |
| C.grass | D.sea animals |
How did seeds of trees, grass and flowers come to the coral islands?
| A.The wind and birds brought them to the coral islands |
| B.Only the wind brought them there |
| C.People brought them there |
| D.Fishes brought them there |
From the article, we know _____________.
| A.small workers can’t do big things |
| B.only big workers can do big things |
| C.small workers can do things if they work hard and work a long time |
| D.all small things can do big things |
任务型阅读(本大题共5分,每空1分)
阅读下列短文,根据短文内容填写表格, 每空限填一词
Traveling is one of the most important activities and people have been interested in it for many years. Modern traffic develops fast, so traveling to different places has become much faster than before. Staying healthy while traveling can make your trip better. But do you know how to keep healthy during a trip? The following information may be useful to you.
Before leaving
Wear comfortable shoes, a hat and sunglasses.
Take some necessary medicine with you. They can be used when you get sick or have other problems.
Do some exercise for weeks or months before you leave if you plan to do lots of walking or climbing during your trip.
Prepare proper food. Before you prepare the food, the first thing you need to think about is how long you will travel with the food. If you take a long trip, you should bring food such as bread, biscuits and some fruit. They don’t go bad quickly. For a nearer trip people can bring meat, fish, eggs, milk and even salads and vegetables.
While traveling
Be sure not to eat dirty food or bad fruit.
Have enough time to take a rest during your trip.
Tap water is not safe, so drink bottled water and always clean the cover of the bottle.
Keep food in good condition. If you take hot food, you should try to keep it hot. For example, you can put it in heavy towels. If you need to keep cold food cold, you can put cold food in a box with ice. When you arrive, put cold food in the fridge. Remember: If you travel with food, keep hot food hot and cold food cold.
| How to Keep |
|
| Before leaving |
Wear comfortable shoes, a hat and sunglasses |
| Exercise for weeks or months before you leave |
|
| Prepare proper food. take bread, biscuits and some fruit for a |
|
| While |
|
| Have enough time to take a rest during your trip. |
|
| Drink bottled water and always clean the cover. |
|
| Keep food in good condition. Try to keep hot food hot and cold food cold. |
life in the future will be different from life today. Between then and now many changes will happen. but what will the changes be?
the population (人口) is growing fast. There will be many people in the world and most of them will live longer than people live now.
computers will be much smaller and more useful, and there will be at least (至少) one in every room. and computer studies will be one of the important subjects in schools then. people will work fewer hours than they do now and they will have more free time for sports, watching TV and travel. Traveling will be much cheaper and easier. And many more people will go to other countries for holidays.
There will be changes in our food, too. More land will be used for building new towns and houses for all the people. Then there will be less room for cows and sheep, so meat will be more expensive. Maybe no one will eat it every day. Instead they will eat more fruit and vegetables. Maybe people will be healthier. Work in the future will be different, too. Robots will do dangerous and hard work. Because of this, many people will not have enough work to do. This will be a problem.in the future there will be _______.
| A.much more fruit | B.more people |
| C.less vegetables | D.less people |
every family will have at least a _____________ in the future.
| A.robot | B.cow |
| C.TV set | D.computer |
in the future people don’t have to __________.
| A.work long hours | B.work fast |
| C.walk on foot | D.eat meat |
people may not eat _________ as much as they do today.
| A.fruit | B.fish |
| C.meat | D.rice |
one big problem in the future is that ___________.
| A.many people don’t have to work |
| B.many people will not be able to find work |
| C.people have to work fast |
| D.all the work will be done by robots |
Interested in Soccer?
Join us now!
King's School is organizing a soccer camp for students aged 15~17. Join us
for 5 days of fun as you learn to play this exciting sport !
When
16~20 September, 2013 (Monday to Friday)
3:00 p. m.~5:00 p. m.
Where Cost
City Sports Hall $ 10 each
267 State Street
Our special offer:
Players from the National Soccer Team will be your coaches for the 5 days of camp! .
Coach Ben Smith--National Soccer Team
Coach Bill Williams-National Soccer Team
Coach Jim White--National Soccer Team captain
Aims
After the camp, you will be able to:
·understand the rules of the game
·carry the ball with your feet
·pass the ball to other players using your feet
·kick the ball towards the goal(球门)
Please come in comfortable shorts, T-shirts and sports shoes.
For more information, please call us at 01159515092, or email us at KS_ soccer camp @hotmail. com. ukThe camp is for the children who _______.
| A.are good at soccer | B.are 15~17 years old |
| C.come from King's School | D.want to relax in camp |
The camp will start on _______.
| A.September 16 | B.September 20 |
| C.Sunday | D.Friday |
If you want to join the camp, you should pay _______ for it.
| A.$5 | B.$6 | C.$7 | D.$10 |
Students in the camp can learn all the skills EXCEPT _______.
| A.carrying the football | B.kicking a goal |
| C.passing the football | D.making game rules |
Which of the following seems to be the most attractive(吸引) to children?
| A.The camp lasts for 5 days. |
| B.The camp doesn't cost much. |
| C.The camp is organized by King's School. |
| D.The coaches will be national soccer players. |
 粤公网安备 44130202000953号